

Fictional demonstration
Self-versus-others comparisons
Self4.10
Others3.28
The useful question is not “who is right”. It is “where does the leader’s view and other people’s experience part company?”
From feedback to follow-through
Pro360Survey is built so a leader can read the feedback, name a small number of priorities and keep those actions visible after the report is delivered.
Illustrative report views — fictional example data, not a client result
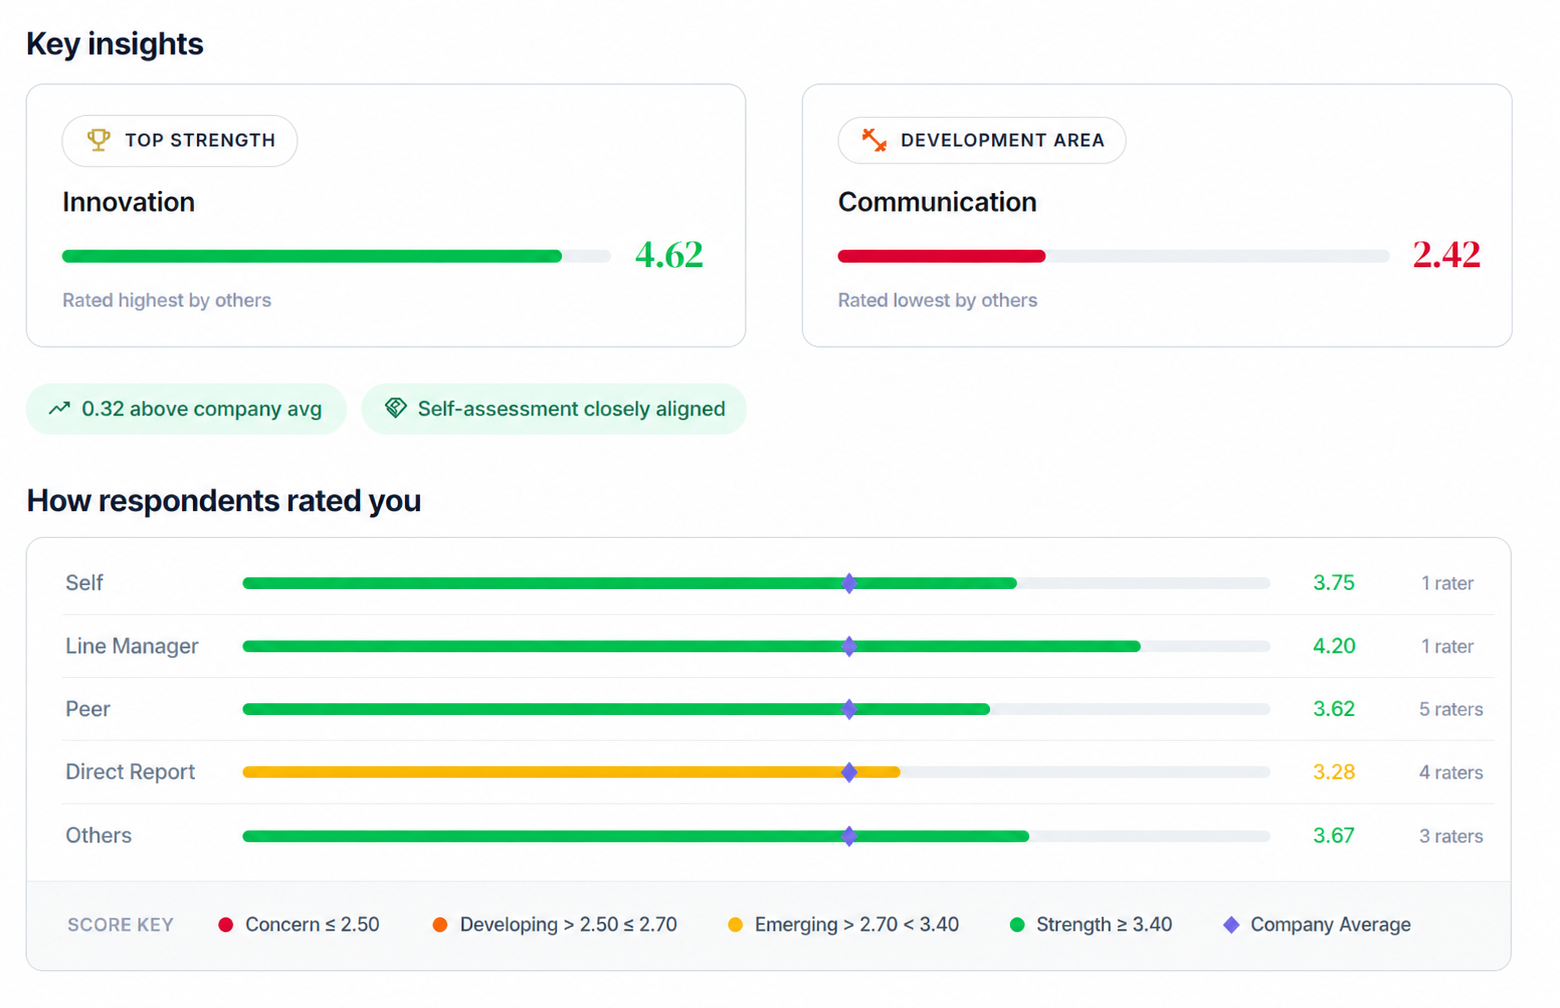
Each participant report is written to be used in a conversation. It is not a dump of every data point. The example alongside shows the kinds of views a report includes.
Fictional demonstration
The useful question is not “who is right”. It is “where does the leader’s view and other people’s experience part company?”
Fictional demonstration
Different groups often see different sides of the same leader. The report keeps those views separate so the conversation stays honest.
Fictional demonstration
A blind spot is a behaviour the leader rates highly that others experience differently. A hidden strength is the reverse—something colleagues already rely on that the leader undersells. The report names both plainly, because they are usually the two most useful discoveries in the debrief.
Strong leaders—and organisations running their second or third 360 cycle—often score well across the board. At that point, absolute numbers alone stop saying anything new.
Every rater has a personal baseline: some hand out 4.5s as a habit, others rarely go above 3.5. Pro360Survey reads each score against the average that rater tends to give. A 4 looks good on paper—but from someone who usually gives 4.5, it is a quiet flag for development. From a tough marker, the same 4 is real praise.
That is why high scorers and repeat participants still leave with genuine insight, not a page of similar numbers.
The report names what others already rely on. Those strengths are part of the development plan, not a polite introduction before the gaps.
Leaders leave with a short list. A report that asks someone to change twelve things usually changes none.
Comments sit alongside the scores so the leader can hear the language colleagues actually use. Access rules for comments are agreed before the campaign starts.
Alongside the individual reports, a team report shows the collective picture: shared strengths, common gaps and the themes a leadership group should work on together.
The action plan does not start from a blank page. It comes with suggested actions drawn from the participant’s own report, which the leader can adapt or replace in the debrief.
From there, the participant records what they will do, with whom, and by when. Those actions remain available so the leader, and the people supporting them, can see whether the work continued after the report date.
This is why the report is not the finish line. A 360 that stops at a PDF asks the organisation to remember the development on its own.